Driver decomposition tells you why the number is what it is. What-If lets you move a promo and see the new curve in seconds. Accuracy backtests run continuously, so a drifting model gets flagged before it costs you a quarter — not after.
Six things every planning team says out loud — and how we fix each one.
We built this module by sitting with demand planners and listening to what they complain about on Monday morning. Each pain below maps to a specific page in the dashboard — no buzzwords, no roadmap promises.
"The forecast lives in one analyst's spreadsheet and breaks the day they're on vacation."
A versioned, auto-rerun pipeline owns the forecast end-to-end. Every model and every input is reproducible — no single point of failure, no copy-paste between tabs.
→ Pipeline
"When the number's off, nobody can tell us why."
Driver decomposition breaks each forecast into its components — seasonality, trend, promotional lift, holiday effects, ad-hoc events. You see, at SKU × customer grain, exactly which signal moved.
→ Intelligence
"Every promo change kicks off a full day of refitting."
What-If lets you tweak assumptions — shift a promo window, change pricing, add a new SKU — and see the forecast move in seconds. Compare scenarios side-by-side before you commit to AOP.
→ What-If
"We won't know if the forecast was right until the month closes."
Accuracy backtests run continuously by brand, segment, and period. MAPE / RMSE / bias trends update with every retrain so you can flag a drifting model before it costs you a quarter.
→ Accuracy
"Every quarter we re-pick the model and retune the seasonality blend."
A self-tuning loop monitors every series. Stable series stay on their current model; drifting series get relearned automatically. You see the retrain queue, not a black box.
→ Learning
"Promoting a new model to production is a leap of faith."
Model Performance vets a candidate model against the incumbent on MAPE / RMSE / bias before promotion. Side-by-side, version-by-version — no production surprises.
→ Model Performance
What's inside
Seven pages, one forecast engine.
Every page reads from the same underlying engine, so the number you see on the Overview is the same one driving What-If, the same one being backtested on Accuracy, and the same one whose drivers are decomposed on Intelligence.
Overview
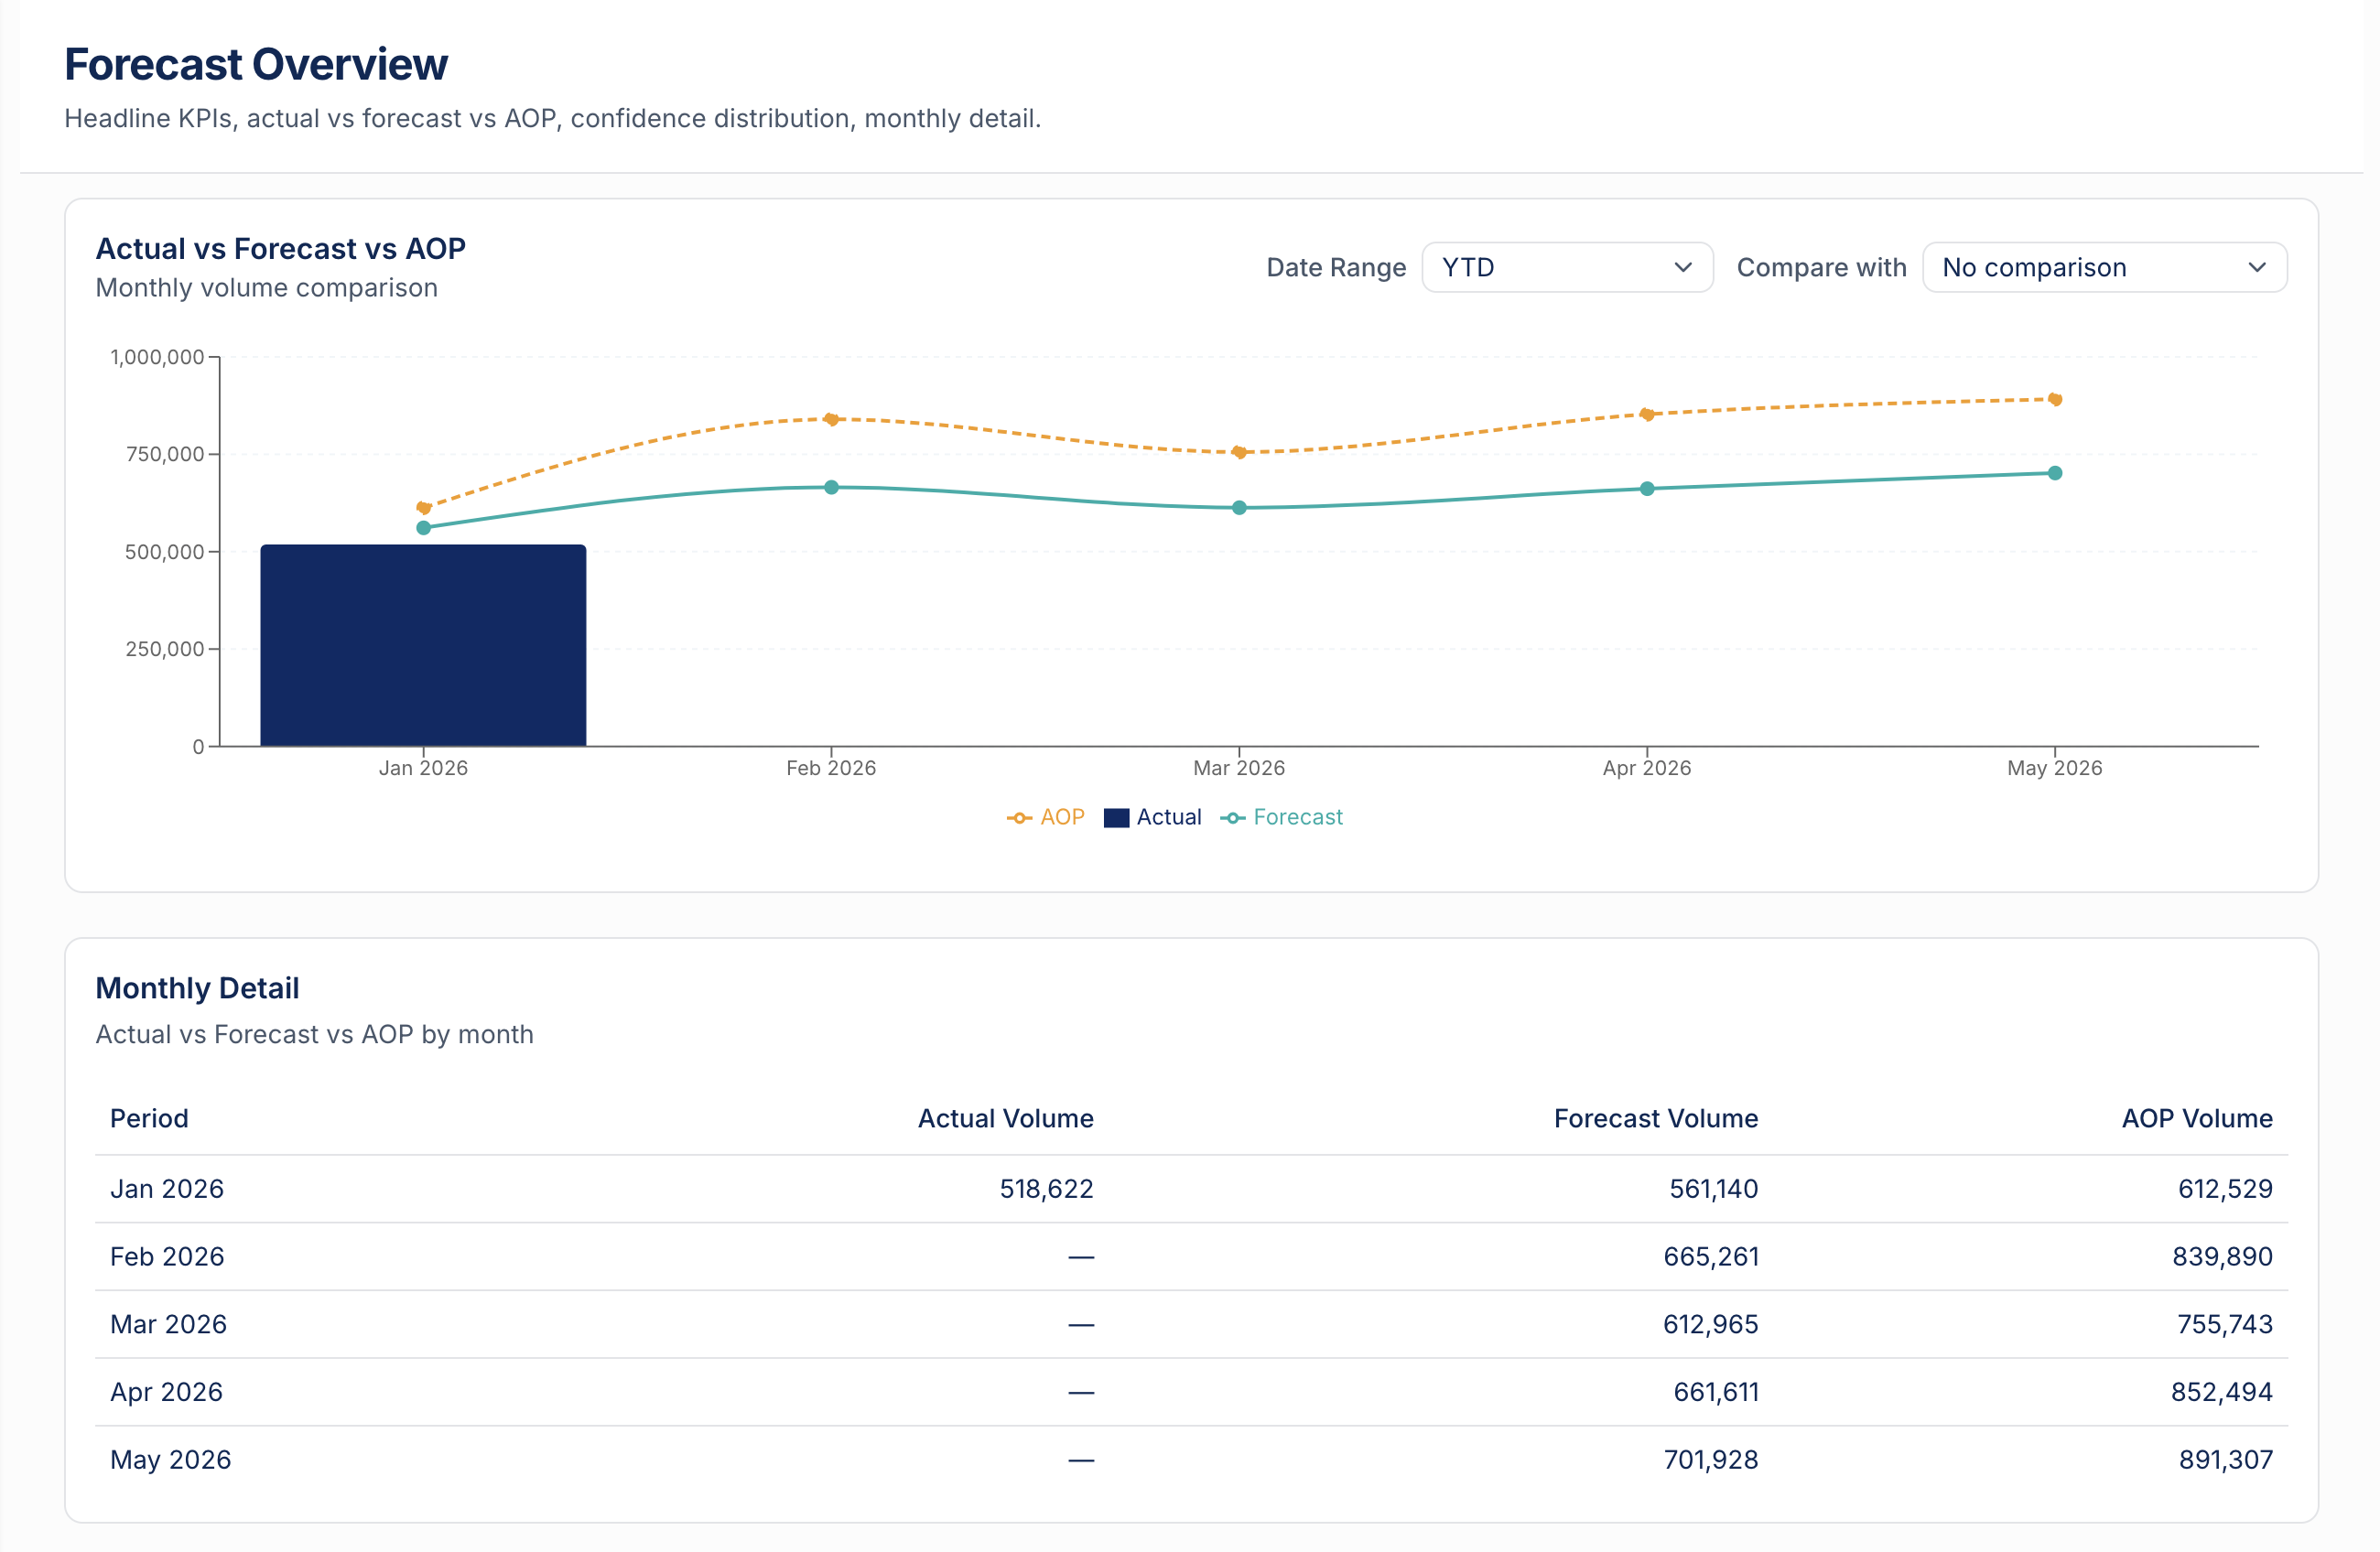
Headline KPIs across the whole module — actual vs forecast vs AOP, confidence distribution, monthly detail. The single screen the planning team opens every Monday.
Pipeline
Stage-by-stage breakdown of the generation pipeline — read raw sources, blend in causal drivers, validate against guardrails, publish to downstream consumers. Click any stage to see what ran, when, and what it produced.
Accuracy
Backtest accuracy by brand × segment × period. MAPE / RMSE / bias trends with month-over-month deltas. Diagnose where the model is reliable and exactly where it drifts.
Intelligence
Driver decomposition — seasonality, trend, promotional lift, holiday effects, ad-hoc events. Each forecast point comes with its 'why' attached, at SKU × customer × month grain.
What-If
Scenario planning. Tweak a promo, shift a launch date, model a new pricing tier — see the forecast move in seconds. Pin scenarios side-by-side before you commit to the AOP.
Learning
Self-tuning state — which series are stable, which are being relearned, and the most recent retrain status. The system surfaces its own work; you don't have to babysit it.
Model Performance
MAPE / RMSE / bias trends across model versions. Used to vet a candidate model against the incumbent before promotion — every release goes through this gate.
What you'll surface
The questions a demand planner walks into S&OP with.
Each view is opinionated about the next question. You don't go looking for the answer — the page brings it forward.
How accurate is our current forecast, and where exactly is it drifting?
What's actually driving next quarter — base demand, promo lift, or seasonality?
If we move this promo by a week, what does volume look like?
Which SKUs are forecast-stable, and which need a planner's attention right now?
Is the new candidate model actually better than what's in production?
How does this year's curve compare to the AOP we committed to last October?
How the pipeline runs
Four stages. Every retrain. Always reproducible.
01
Read
Pull from the canonical gold layer — sales, customer master, product master, holidays, promos. No copy-pasting between files; the same data the rest of the dashboard sees.
02
Blend
Hierarchical middle-out: brand × segment × SKU forecasts reconciled top-down and bottom-up. Causal drivers (promo, holiday, price) attached as features.
03
Validate
Guardrails check the candidate forecast against bounds, the prior period, and the AOP. A drift flag pauses the publish step until a planner reviews it.
04
Publish
Versioned outputs hit the dashboard and any downstream consumer. Every prior version is queryable — no overwrites, no surprises.
What we need from you
Three files for a baseline forecast. Three more unlock the drivers.
Required sources give you the volume curve. Holiday and promo calendars turn on causal driver decomposition; the AOP enables plan-vs-forecast variance overlays.
Source
Description
Required
sales
Sales transactions
Required
product_master
Product master
Required
customer_master
Customer master
Required
holidays
Holiday + event calendar
Optional
promo_calendar
Promotional calendar
Optional
aop
Annual Operating Plan
Optional
Full schema details on the Data Schema page once you sign in.
Ready to see it on your data?
Request a demo and we'll walk you through the modules with sample data shaped like yours.