Know exactly who buys, who's slipping, and who's worth more.
Nine views on your customer base — from a Pareto of concentration to a per-customer P&L after cost-to-serve.
Segmentation, lifecycle and churn, distribution coverage, assortment compliance, and a health scorecard that triages every account into Strong, Moderate or At-Risk. Every filter cascades across the module, so the slice you pick carries from page to page.
Each page sits one click from the others. The filters you set — date range, channel, sub-channel, region, partner level, segment — carry across the module so you're always slicing the same base.
Overview
Headline KPIs current-year vs last-year — active customers, net revenue, gross profit and margin — with revenue trend, channel mix, region mix, a Pareto concentration curve, and your top-N customers. The single screen the commercial team opens to know where the base stands today.
Segmentation
Active vs inactive on a rolling three-month cutoff, a Partner-Level Pareto (Ambassador / Champion / Growth / Emerging), RFM scoring, sub-channel breakdowns, and Sankey flows that show how customers move between segments over time.
Growth & Retention
Five lifecycle segments — New, Retained, At-Risk, Lost, Reactivated — with a churn rate, a revenue-bridge waterfall from last year to this year, and a cohort-retention matrix. The at-risk list is your sales-team call sheet, sorted by largest decline first.
Customers per Channel
Monthly active customers by channel and sub-channel, with prior-month and prior-year deltas and month-over-month variation, so you can see exactly where the buying base is expanding or thinning out.
Scorecard
Five health metrics per customer — revenue growth, volume growth, SKU distribution, order frequency and net margin — each RAG-thresholded, rolling up to a Strong / Moderate / At-Risk rating so account managers can triage at a glance.
Customer Profitability
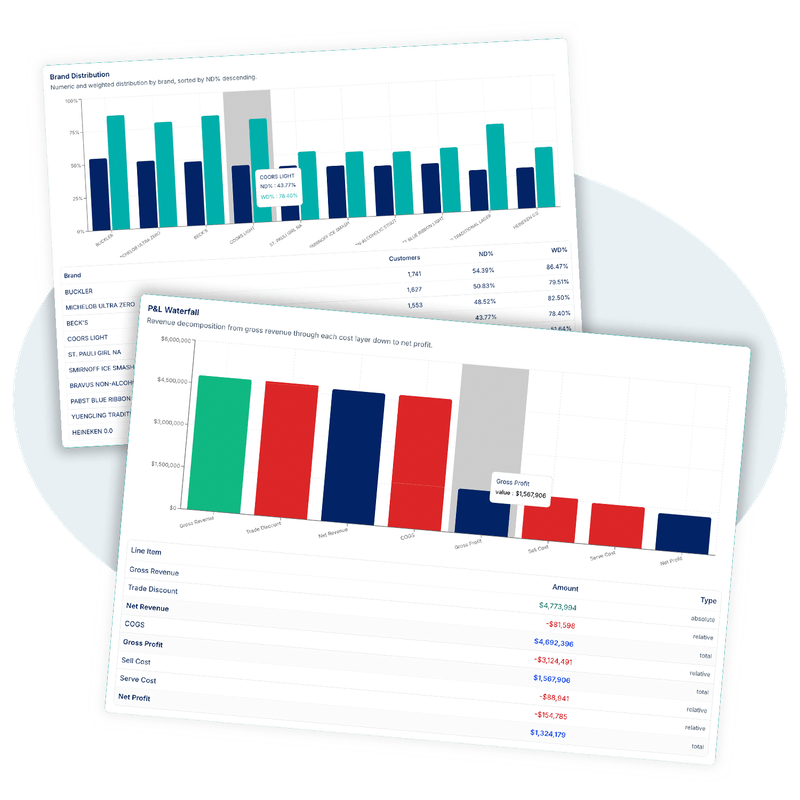
A full P&L waterfall from gross revenue down to net profit, a Growth × Profitability quadrant, cost structure by channel, margin distribution by partner level, and the top most- and least-profitable customers — the renegotiation shortlist, made from your own cost-to-serve.
Distribution Coverage
Numeric (ND%) and Weighted (WD%) distribution per brand, a coverage rate for this year's buyers against last year's universe, coverage by channel, and a gap table of customers missing your top brands — the white space, quantified.
Assortment Compliance
Mandatory SKU range (brands with ≥30% sub-channel penetration), a per-customer compliance score, the revenue opportunity behind each gap, and new-product adoption tracking over a six-month lookback with an adoption trend.
Active Customer Master
A living definition of an active account (≥1 purchase in the last three months) with purchase frequency, volume and revenue per purchase, SKU breadth, and frequency bands — High, Regular, Occasional, Rare — so nobody argues about who counts as a customer.
What you'll surface
The questions every commercial leader asks about the base.
The Customers module is built around the conversations distributors and CPG manufacturers actually have — not generic BI. Each view is opinionated about the next question, and the filters carry you straight to it.
Who are our customers, how concentrated is the base, and how much of it is actually active?
Which accounts are growing, which are quietly slipping, and who needs a call this week?
How many customers did we lose since last year — and how much revenue walked out with them?
Which customers make money after cost-to-serve, and which should we renegotiate?
Where are the distribution gaps — which accounts don't stock our top brands yet?
Are customers complying with the mandatory range, and are they adopting new products?
Three files to start. Three more unlock profitability.
Map your existing spreadsheets to our canonical schema through the ingestion wizard — column names don't need to match ours. Required sources power segmentation, growth and coverage immediately; the cost files turn on the per-customer P&L.
Source
Description
Required
sales
Sales transactions
Required
customer_master
Customer master
Required
product_master
Product master
Required
cogs
COGS — factory price
Optional
cstell
Cost to sell
Optional
ctserve
Cost to serve
Optional
Full schema details on the Data Schema page once you sign in.
Ready to see it on your data?
Request a demo and we'll walk you through the modules with sample data shaped like yours.