Every SKU has a job. This module tells you which ones aren't doing it.
Thirteen views on your portfolio — from a BCG role matrix to a delisting score built from your own margin and cost-to-serve.
Portfolio roles, GP decomposition, price-pack tiers, lifecycle and NPD vitality, distribution velocity, cannibalization, promo dependency, assortment white-space, seasonality, and an interactive map of where every SKU actually sells. One click generates the Executive Brief PDF.
Each page sits one click from the others. The filters you set — date range, channel, sub-channel, region, partner level, segment — carry across the module so you're always slicing the same base.
Overview
A 22-field KPI board current-year vs last-year — revenue, volume, gross profit, margin, active SKUs, average price — with a Pareto concentration curve, revenue trend, and brand and category mix. The single screen that frames the whole portfolio.
Portfolio Roles
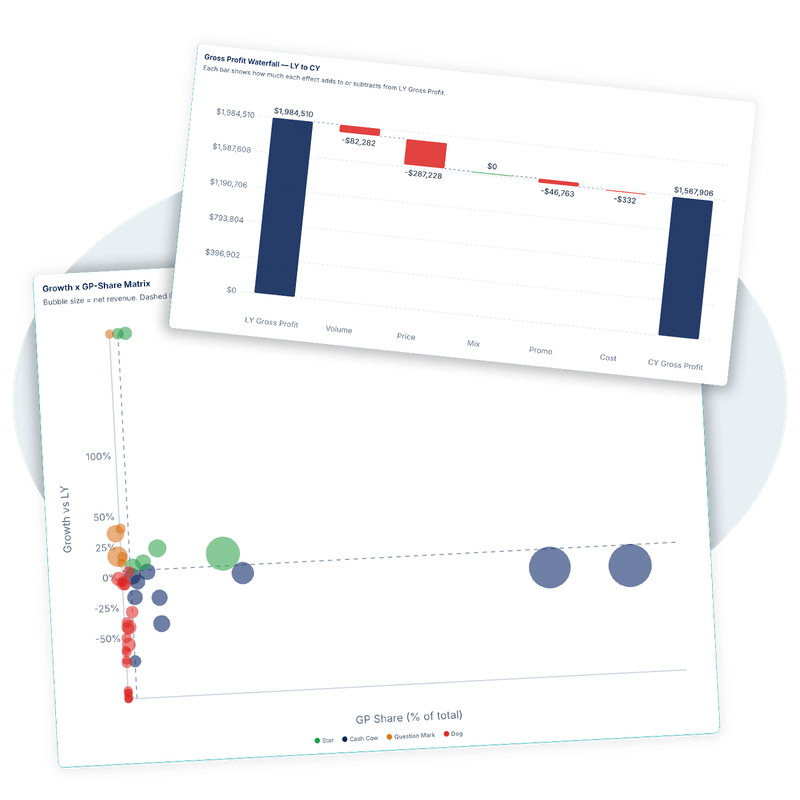
A BCG-style matrix classifying every SKU as Star, Cash Cow, Question Mark or Dog on growth and share, so you can see at a glance which products fund the portfolio and which are candidates for investment or exit.
GP Bridge
A five-effect decomposition of gross-profit movement — Volume, Price, Mix, Promo and Cost — that reconciles exactly, so when margin moves you know which lever moved it, not just that it moved.
Price-Pack
Value / Mainstream / Premium tiers derived from the 33rd and 66th price percentiles within each category, revealing your price-pack architecture and where the ladder has gaps a competitor can walk into.
Innovation & Lifecycle
Launch / Growth / Maturity / Decline lifecycle staging plus an NPD-vitality score — how much of revenue comes from products launched recently — so innovation stops being a gut feel.
Distribution & Velocity
Numeric (ND%) and Weighted (WD%) distribution and Rate-of-Sale per SKU, so you can separate a product that's everywhere but slow from one that's fast but under-distributed.
Margin Pool
A full P&L waterfall from sales revenue to net profit per SKU, with a cost-to-serve flag so the view degrades gracefully when service costs aren't loaded — the profit pool, ranked.
SKU Tail
A composite delisting score from 0 to 100 combining revenue, margin, distribution and velocity, with a tunable tail cutoff — the rationalization shortlist, defensible in the room.
Cannibalization
Within-customer volume-correlation analysis that flags SKUs eating each other's demand, so a 'growing' launch that's really just stealing from a sibling doesn't fool the plan.
Promo Dependency
A dependency score from 0 to 100 per SKU measuring how much of its volume only moves on deal — the products that look healthy until you turn the promo off.
Assortment Gaps
Peer-group white-space detection: for each customer, the high-performing SKUs its peers stock that it doesn't — a ranked, revenue-weighted list of the assortment you're leaving on the table.
Seasonality
A seasonal index (100 = average month) per SKU with strength and stability tags, so planning and promo timing line up with how each product actually sells across the year.
Distribution Map
An interactive MapLibre map with region bubbles and customer pins, product comparison overlays, and white-space detection — see exactly where a SKU or brand sells, and where it should but doesn't.
What you'll surface
The questions every category and portfolio lead has to answer.
The Products module is built around the conversations distributors and CPG manufacturers actually have — not generic BI. Each view is opinionated about the next question, and the filters carry you straight to it.
Which SKUs are Stars worth defending, and which Dogs are just complexity?
When gross profit moved, was it volume, price, mix, promo or cost?
Which products only sell on deal — and what happens to volume if we stop?
Which SKUs are in the tail and safe to delist without losing customers?
Where are the assortment gaps — what do peers stock that this customer doesn't?
Where does each product actually sell, and where is the white space on the map?
Three files to start. Cost and promo files unlock the full margin view.
Map your existing spreadsheets to our canonical schema through the ingestion wizard — column names don't need to match ours. Required sources power the portfolio, roles and distribution views immediately; the cost and promo files turn on the margin pool, SKU tail and promo-dependency analysis.
Source
Description
Required
sales
Sales transactions
Required
product_master
Product master
Required
customer_master
Customer master
Required
cogs
COGS — factory price
Optional
cstell
Cost to sell
Optional
ctserve
Cost to serve
Optional
promo_calendar
Promotional calendar
Optional
Full schema details on the Data Schema page once you sign in.
Ready to see it on your data?
Request a demo and we'll walk you through the modules with sample data shaped like yours.