Portfolio Health
A composite scorecard — the default landing — that grades the portfolio as the worst of its four sub-statuses (never the flattering average), flagging rate creep only when a real price effect and a rising load coincide.

Variance & RGM module
Five views that decompose every change into volume, price, mix, trade and cost — and reconcile exactly, every time.
Price-Volume-Mix bridges, gross-to-net leakage, premiumization vs down-trading, and a customer/channel P&L that surfaces the At-Risk and Hidden-Win accounts a revenue-only view can't see. Every window is compared to the same window one calendar year back.
What's inside
Each page sits one click from the others. The filters you set — date range, channel, sub-channel, region, partner level, segment — carry across the module so you're always slicing the same base.
A composite scorecard — the default landing — that grades the portfolio as the worst of its four sub-statuses (never the flattering average), flagging rate creep only when a real price effect and a rising load coincide.
The Price-Volume-Mix bridge — plus Trade and Cost effects for gross profit — decomposing every revenue and GP change into its drivers. It reconciles exactly: delta = volume + price + mix + NPI + delist, asserted and shown on screen.
Gross-to-net realization: where list price leaks to net through discounts and trade, split into a controllable rate effect and a mechanical volume effect, so you know which leakage you can actually fix.
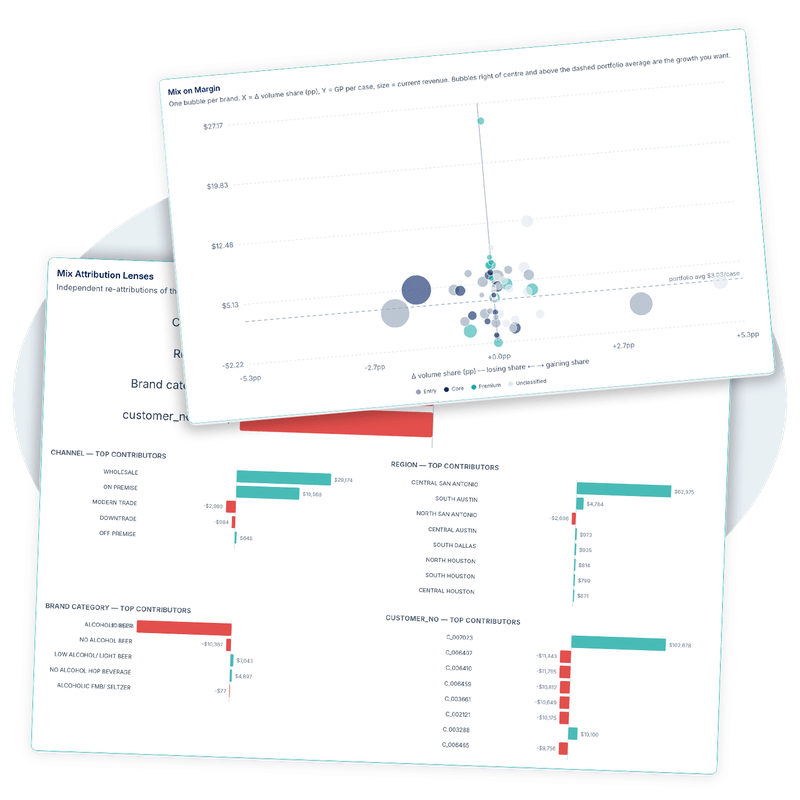
Premiumization vs down-trading measured on category-local price tiers, with an HHI concentration read — is the mix improving because customers trade up, or eroding because they trade down?
Per-segment P&L with account classes that a revenue-only view misses — At-Risk (revenue up, GP down) and Hidden Win (revenue down, GP up) — plus migration between classes and a Pareto of contribution.
What you'll surface
The Variance module is built around the conversations distributors and CPG manufacturers actually have — not generic BI. Each view is opinionated about the next question, and the filters carry you straight to it.
What we need from you
Map your existing spreadsheets to our canonical schema through the ingestion wizard — column names don't need to match ours. Required sources power the revenue bridge, realization and mix quality immediately; the cost files turn on the gross-profit decomposition and customer P&L.
| Source | Description | Required |
|---|---|---|
| sales | Sales transactions | Required |
| customer_master | Customer master | Required |
| product_master | Product master | Required |
| cogs | COGS — factory price | Optional |
| cstell | Cost to sell | Optional |
| ctserve | Cost to serve | Optional |
Full schema details on the Data Schema page once you sign in.
Request a demo and we'll walk you through the modules with sample data shaped like yours.
Request a demo