Overview
Fifteen headline KPIs current-year vs last-year with a monthly trend and profitability by channel and category — plus the one-click Executive Brief PDF. The screen finance opens before every review.

Financials module
Nine views from the headline P&L down to a single SKU's margin, every bridge reconciling exactly to net profit.
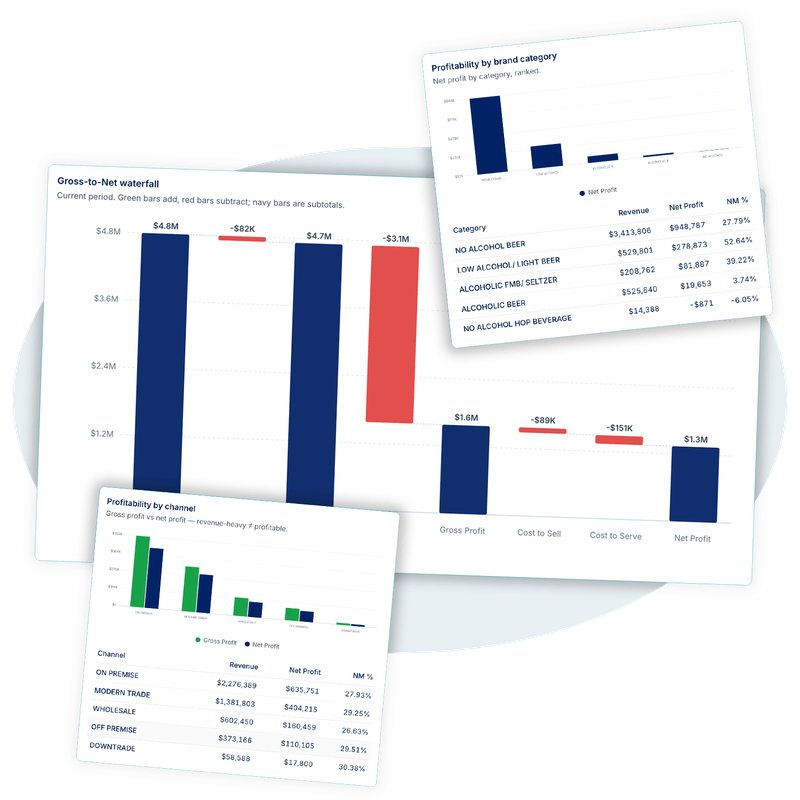
Gross-to-net waterfall, margin decomposition, profitability by customer, SKU and geography, cost-to-serve at invoice grain, and a forecast-vs-actual bridge for the rest of the year. One click generates the Executive Brief PDF.
What's inside
Each page sits one click from the others. The filters you set — date range, channel, sub-channel, region, partner level, segment — carry across the module so you're always slicing the same base.
Fifteen headline KPIs current-year vs last-year with a monthly trend and profitability by channel and category — plus the one-click Executive Brief PDF. The screen finance opens before every review.
A board-ready profit-and-loss, current vs prior year with each line as a percent of net revenue, alongside a monthly wide table — the statement, exactly as leadership expects to read it.
An eight-step gross-to-net waterfall from gross revenue to net, with load KPIs, a year-over-year stage comparison, and load-by-channel — every deduction between list and net, named.
A Volume / Price / Trade / Cost / Mix decomposition of the gross-profit change, per segment, reconciling exactly to ΔGP — with driver detail and a by-channel view.
A per-customer profit-and-loss with a Pareto of contribution, dollar and per-case waterfalls, a detail table, and a value-creation scatter — who actually makes you money after everything.
Per-SKU margin with a Pareto, a category-coloured scatter, a category rollup, and a rationalization bottom-25 — the products dragging the pool, ranked for the delisting conversation.
Service economics at invoice grain — drop-size bands, service cost by channel, a service-intensity scatter, and the top drains — so the cost of serving small, frequent orders is finally visible.
Customer P&L placed on an interactive MapLibre map — by customer, region or city — with a net-margin colour ramp, a region roll-up, and the top cities, so profitability has a geography.
A full-year landing estimate with an AOP-to-LE bridge, channel variance, and brand × channel movers — built from your AOP, the forecast module's output, and actuals to date.
What you'll surface
The Financials module is built around the conversations distributors and CPG manufacturers actually have — not generic BI. Each view is opinionated about the next question, and the filters carry you straight to it.
What we need from you
Map your existing spreadsheets to our canonical schema through the ingestion wizard — column names don't need to match ours. Sales plus your cost stack power the full P&L and every profitability view; the AOP unlocks the forecast-vs-actual outlook.
| Source | Description | Required |
|---|---|---|
| sales | Sales transactions | Required |
| customer_master | Customer master | Required |
| product_master | Product master | Required |
| cogs | COGS — factory price | Required |
| cstell | Cost to sell | Required |
| ctserve | Cost to serve | Required |
| aop | Annual Operating Plan | Optional |
Full schema details on the Data Schema page once you sign in.
Request a demo and we'll walk you through the modules with sample data shaped like yours.
Request a demo