The commercial cockpit your team will actually open every morning.
Nine views built on one data model — from boardroom-ready P&L cascade down to the individual invoice line, with depot-by-depot and rep-by-rep maps of where your customers actually live.
Customer profitability, cohort lifecycle, SKU performance, plan-vs-actual variance, and a one-click executive PDF for the leadership meeting. All filters cascade transitively across pages, so the slice you pick on one screen carries to the next.
Each page sits one click from the others. The filters you set — date range, channel, sub-channel, region, warehouse, brand, segment, partner level — carry across the module so you're always slicing the same dataset.
Executive Overview
Headline KPIs across every page of the module on a single screen — net revenue, gross profit, AOP achievement, retention rate, active SKUs, top-20 customer concentration. Tolerant rendering: panels load independently, so a slow source never blocks the rest of the view.
Analytics — P&L cascade
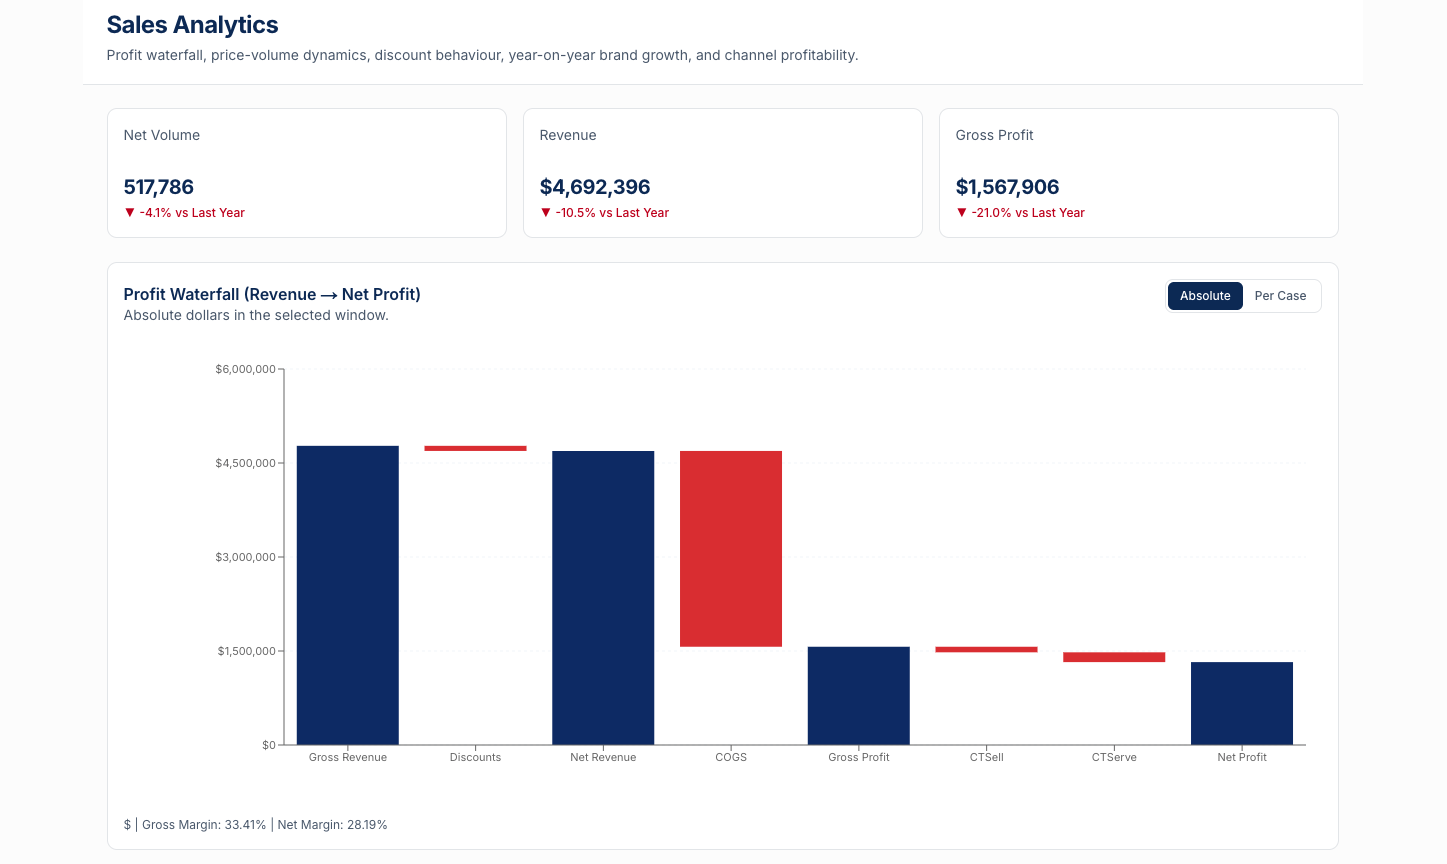
Profit waterfall from gross revenue down to net profit, with a one-click toggle between absolute totals and per-case. Brand growth/decline rankings, monthly cost-mix sparklines, and a channel-brand margin heatmap surface the patterns that drive the cascade.
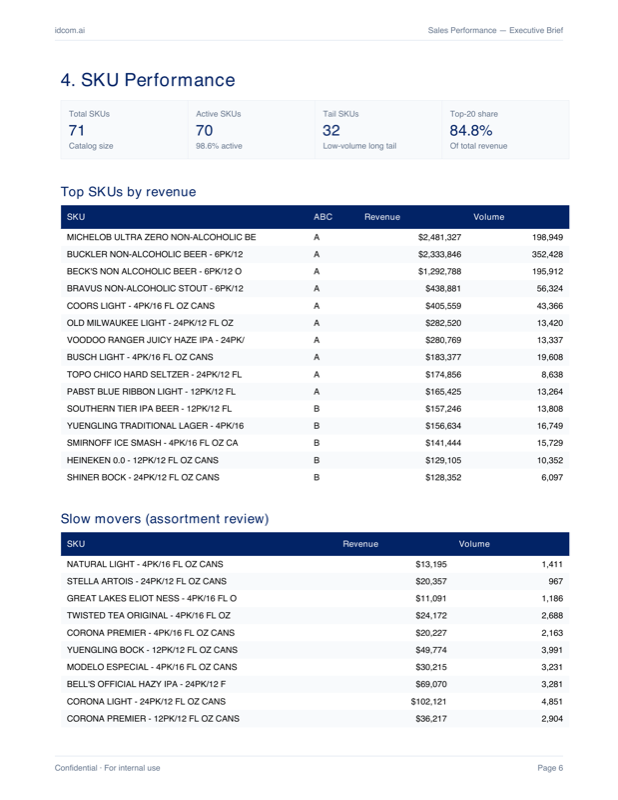
SKU Performance
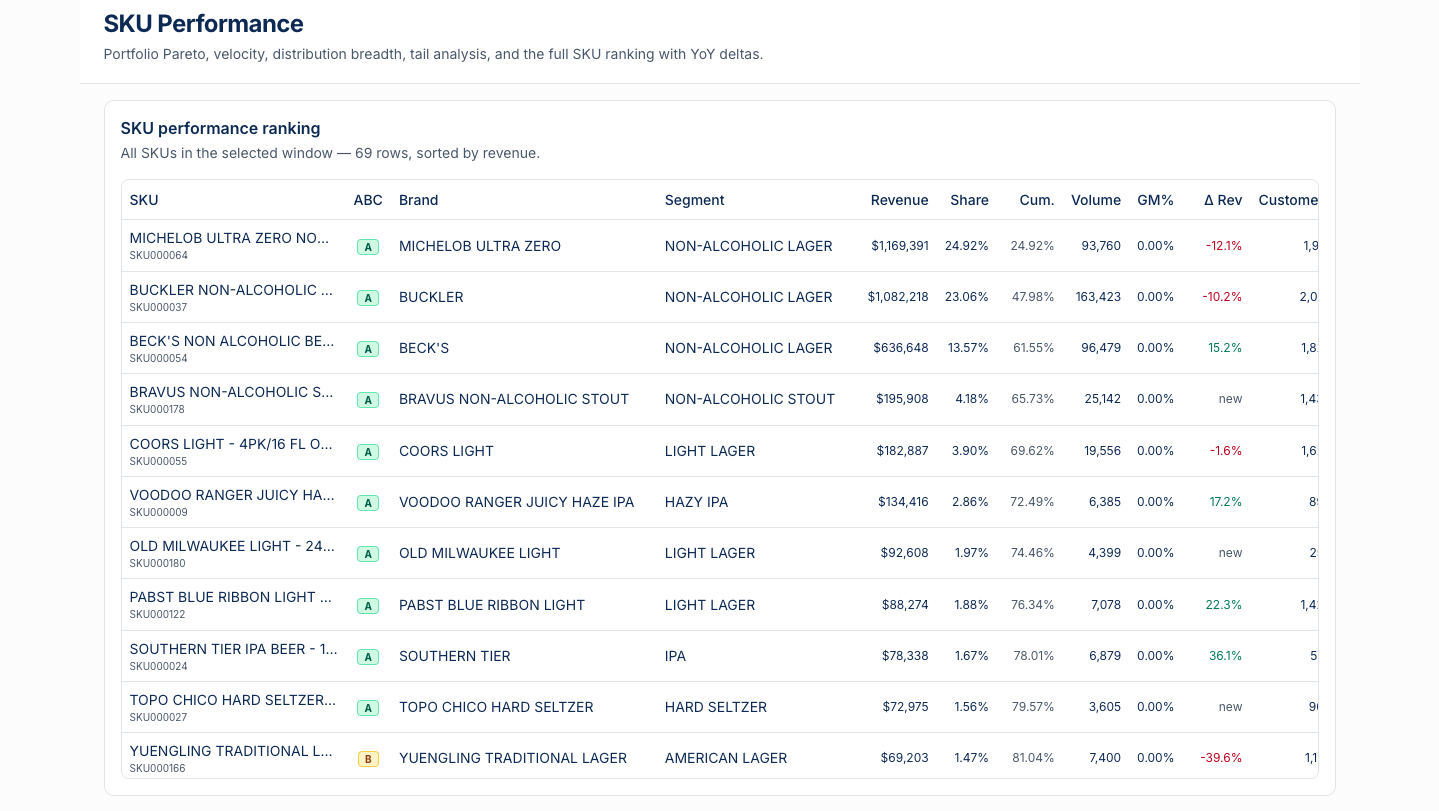
ABC classification, active vs tail mix, top-N by revenue and by velocity, plus a slow-mover candidate list for assortment-cleanup conversations. Each SKU links into the same Sales filter context so you can drill from portfolio view to invoice line in two clicks.
Warehouse
Distributor networks live or die by their depots, but most BI hides that view inside cost-to-serve spreadsheets. The Warehouse page rolls every metric up to the DC: revenue league table with YoY% and gross-margin tint, channel and CDP mix per warehouse, monthly trend lines, and an interactive map of every depot with the customers it serves — color-coded by sub-channel, partner level or CDP, with click-to-hide legend toggles and a service-line overlay that shows exactly which depot delivers to which account.
Sales Rep / Territory
Field-sales orgs spend Monday morning wondering who's carrying the team and who's quietly slipping. This page rolls every Sales metric up to the rep — toggle between the manager and supervisor hierarchy — with a league table of revenue, YoY, gross margin, new / lost / at-risk customer counts, top-customer concentration and AOP attainment. A dedicated coaching-flag panel surfaces concentration risk, double-digit YoY declines, reps that opened zero new customers and reps losing five or more accounts. Bottom of the page: a territory map of each rep's customers, on the same MapLibre canvas as the Warehouse page.
Customer Profitability
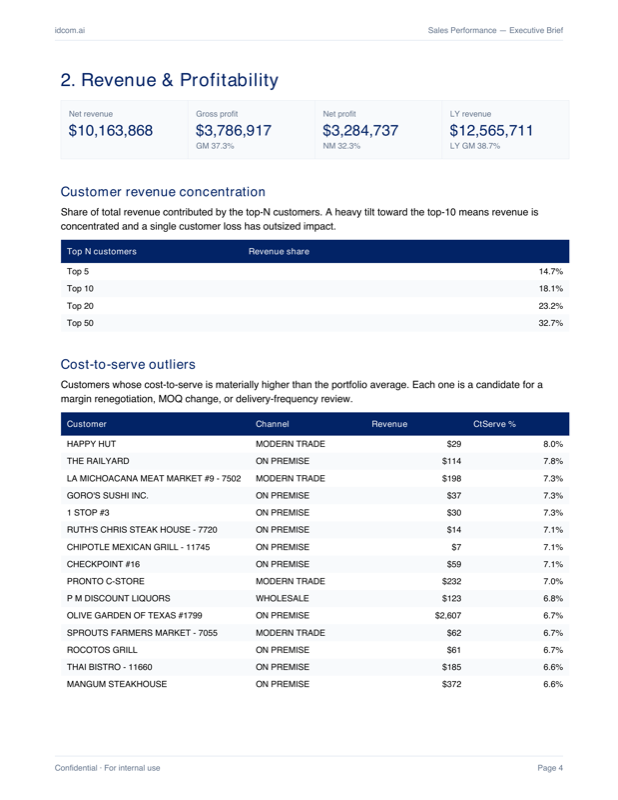
Per-customer P&L with revenue concentration (top-5 / 10 / 20 / 50), Growth × Profitability quadrants, cost-to-serve outliers (renegotiation candidates), and tenure-cohort comparisons that answer whether new customers are more or less profitable than long-standing ones.
Plan vs Actual
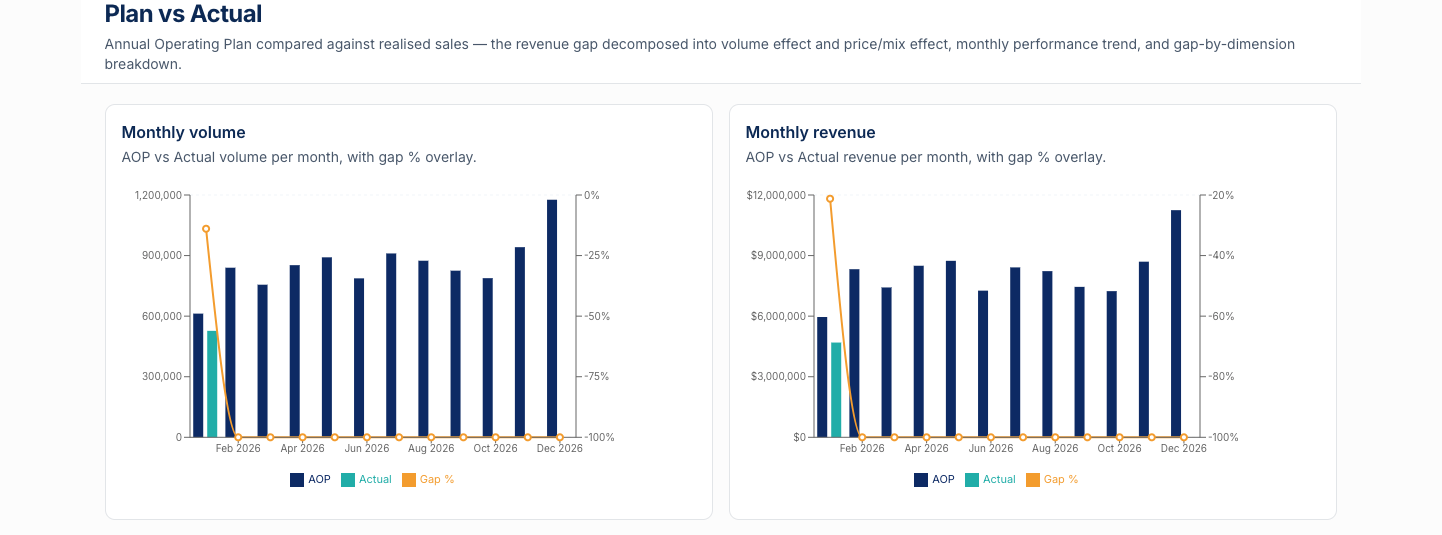
AOP variance bridge by month, top positive and negative gap contributors at customer and SKU grain, and a run-rate projection that tells you whether the year is tracking ahead or behind plan — with a phasing diagnostic that distinguishes timing slips from real shortfalls.
Customer Cohort
New / Retained / Lapsed segmentation with a revenue bridge from last year to this year, an acquisition-cohort retention curve, and an at-risk list — retained customers whose revenue is down more than a tenant-configurable threshold (default 20%). Sales-team call list, sorted by largest decline first.
Invoice Explorer
Transaction-level drill-through with multi-select filters that cascade transitively (pick a channel and the sub-channel list narrows automatically). Aggregate KPI cards at the top reflect the filtered slice in real time so you can scope to a customer, a date window, a sub-channel — and immediately see the totals.
What you'll surface
The questions every commercial leader is asked at Monday review.
The Sales module is built around the actual conversations distributors and CPG manufacturers have — not generic BI dashboards. Each view is opinionated about what the next question will be, and the filters carry you straight to it.
How did revenue move versus last year — and which brands or channels drove it?
Which customers are growing, which are quietly declining, and who needs a call this week?
Are we on track to hit AOP this year — and if not, where exactly is the gap?
Which SKUs are pulling their weight and which are dragging margin or tying up working capital?
How many customers from last year are no longer buying — and how much revenue did they take with them?
Where is our cost-to-serve eating most of the margin — and which customers should we renegotiate?
Which depot is the most profitable to operate — and where are our customers physically concentrated on the map?
Which sales reps are carrying the team — and which need a coaching conversation this week?
One click, boardroom-ready
The Sales Executive Brief, generated on demand.
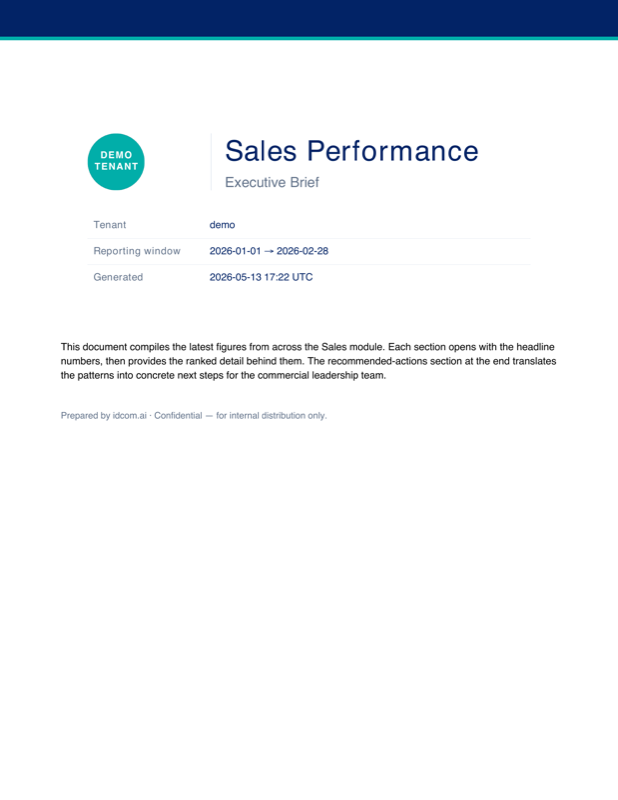
Click Generate Executive Brief on the Overview page and a multi-page PDF lands in your downloads folder seconds later. Cover page with your tenant logo, automatic table of contents, six narrative sections — Executive Summary, Revenue & Profitability, Customer Health, SKU Performance, Plan vs Actual — and a prioritised Recommended Actions list pulled straight from the data.
Same filters you have on the page carry into the PDF, so the brief you generate while scoped to a region or partner level is exactly that slice. No copy-paste, no slide-deck assembly.
What we need from you
Three files to start. Four more unlock the full cascade.
Map your existing spreadsheets to our canonical schema through the ingestion wizard — column names don't need to match ours. Required sources get you the headline pages immediately; optional sources turn on the cost cascade and Plan-vs-Actual.
Source
Description
Required
sales
Sales transactions
Required
customer_master
Customer master
Required
product_master
Product master
Required
warehouse_master
Warehouse master (DC coordinates + name)
Optional
cogs
COGS — factory price
Optional
cstell
Cost to sell
Optional
ctserve
Cost to serve
Optional
aop
Annual Operating Plan
Optional
Full schema details on the Data Schema page once you sign in.
Ready to see it on your data?
Request a demo and we'll walk you through the modules with sample data shaped like yours.